
This library guide was developed with the support of the Gonzaga University Institute for Climate, Water, and the Environment. The project began with Climate Project Assistants Ellen Lewis and CJ Kreitlow (Spring 2025), who compiled and organized the initial set of featured resources. Since then, Claire Cooney and Michael McLoud (Spring 2026) expanded upon this foundation through additional research and helped to structure the guide for publication.
We would like to thank Gonzaga Climate Institute staff members Mary Condon, Dante Jester, and Dr. Brian G. Henning for their editorial guidance. We also extend our appreciation to the staff of the Gonzaga University Foley Library, especially IT and Web Manager Anji Mertens, for their invaluable assistance in navigating the LibGuide platform throughout this process.
Please contact the Climate Institute with any questions, comments, or requests for updates: ClimateInstitute@gonzaga.edu .
Version 1.0 of this guide was published November 2025.
Within and beyond the western United States, wildfire smoke and extreme heat events are becoming longer and more frequent due to the changing climate. This is a result of earlier snowmelt in the spring, which leaves lands drier for longer and acts as forest fuel for prolonged wildfires 1. In Spokane, these climate-driven challenges are intensified by the urban heat island effect. Dense gray infrastructure like roads and bridges, combined with limited tree cover and green space, traps heat and makes extreme temperatures feel even hotter 4. When combined, these climate and urban stressors have contributed to a dramatic rise in high-temperature days and unhealthy air quality in the Spokane region (see Figure 1). Since 1950, the average annual temperature in Spokane has increased by 2°F relative to mid-20th century averages, and peak summer temperatures have risen by 3.5°F since 1979 2. By the end of the century, without dramatic action to reduce heat trapping emissions, these temperatures are expected to rise by at least another 10°F 2. These harsh increases in temperature are linked to various severe weather events, like the 2021 northwest heat dome, which resulted in 19 heat-related deaths in Spokane (~159 statewide) and put immense pressure on city resources 2, 3, 10. Furthermore, while total annual precipitation in the region may remain stable, many climate projections indicate a seasonal shift taking place, where summer rainfall is expected to decline by 14% by the end of the century 2. At the same time, winter precipitation is projected as rain instead of snow (a winter streamflow increase of ~84%), which raises the risk of winter flooding and increases the risk of drought following precipitation events 2. These changing patterns make the landscape more susceptible to wildfire and prolong this cycle of environmental crises for the region.
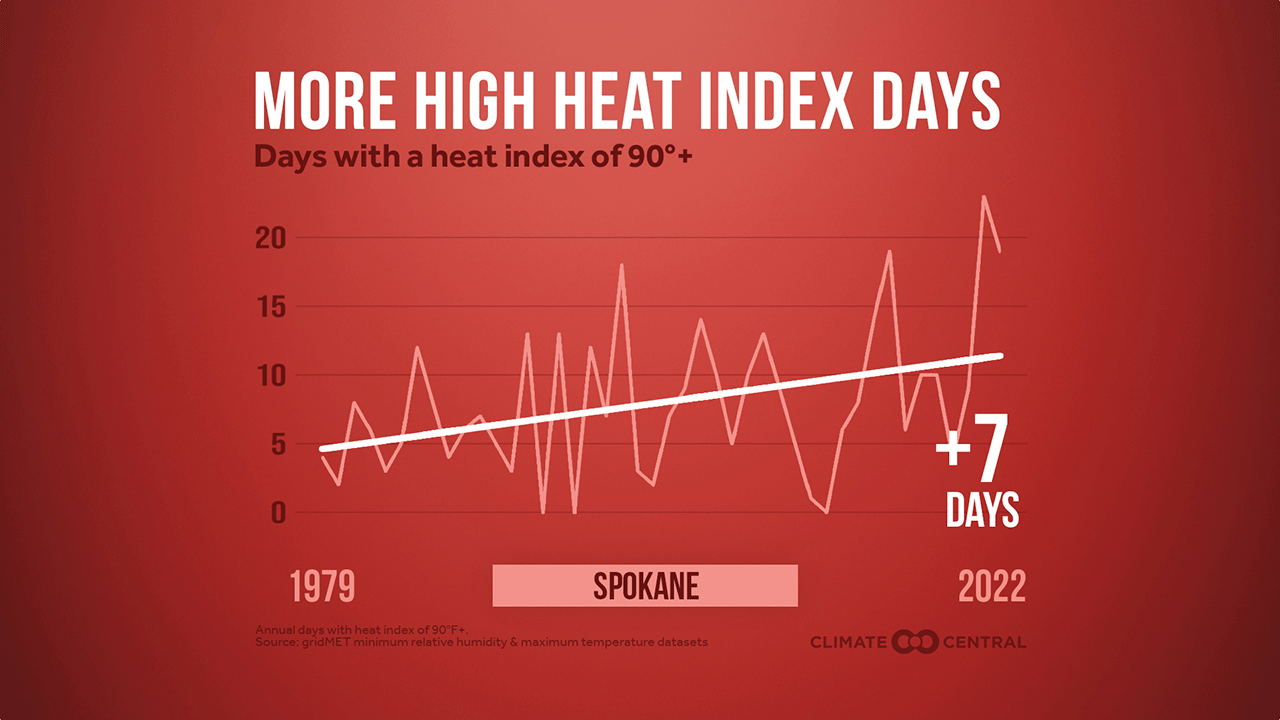
Figure 1. Climate Central high heat index days in Spokane 4.
Wildfire smoke contains microscopic particles, called PM2.5, that pollute the air and can cause harmful short- and long-term health effects when inhaled 5. Both outdoors and indoors, these microscopic particles can get into one’s eyes and respiratory system, where they can cause acute health problems such as burning eyes, runny nose, throat irritation, fatigue, headache, coughing, wheezing, and shortness of breath. Fine particles can also aggravate chronic heart, lung, and respiratory diseases and have been linked to premature death in people with pre-existing conditions. Symptoms from exposure to PM2.5 often go unnoticed, so it is important to know the signs and how to prevent them altogether. For a healthy individual, there are usually low health risks from short-term exposures to smoke, but it is always a good idea to avoid contact if possible 5,6. Many tools, such as the air quality index (AQI) chart in Figure 2, can help serve as reference during wildfire smoke events.
The following individuals are found to be more at-risk from exposure to particulate air pollution 5,6:
People with pre-existing health conditions such as:
Lung disease, asthma, Chronic Obstructive Pulmonary Disease (COPD), and emphysema
Respiratory infections, pneumonia, acute bronchitis, colds, or flu
Heart or circulatory problems, dysrhythmias, congestive heart failure, coronary artery disease, and angina
Prior history of heart attack or stroke
Diabetes (more likely to have an undiagnosed cardiovascular disease)
Adults over the age of 65 (more likely to have unrecognized heart or lung diseases)
Children and teenagers (lungs are still developing and they breathe more air per pound of body weight than adults)
Pregnant individuals (and the fetus)
People who smoke (more likely to have lung diseases and decreased lung function)
Outdoor workers
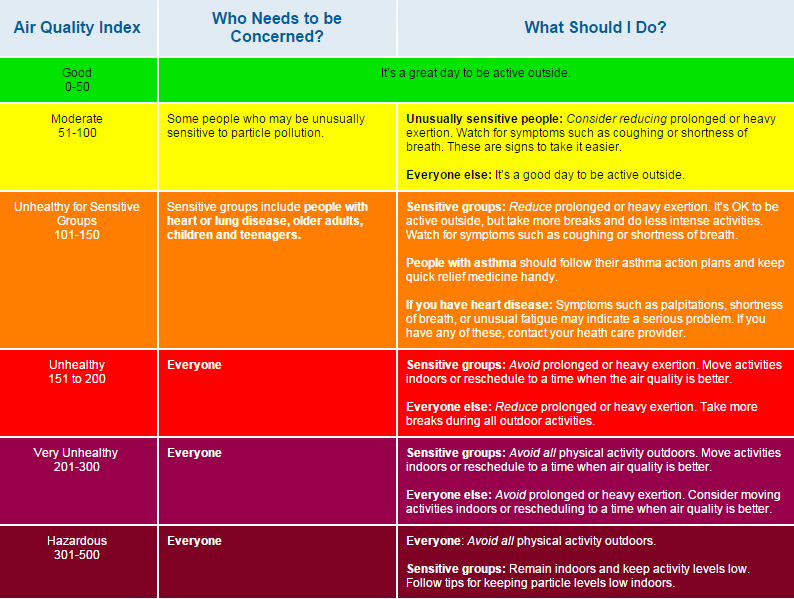
Figure 2. EPA Air Quality Guide for Particle Pollution 5.
As extreme heat events become more common in the United States generally, and the Spokane region in particular, increased understanding of heat-related illnesses and how to prevent them is crucial for staying safe and comfortable. Heat-related illnesses, such as heat exhaustion and heat stroke, can be extremely dangerous but are preventable. Often, the symptoms of these illnesses come on fast and can go unnoticed, so it is important to know what they can look like. With general heat exhaustion, symptoms often include dizziness, thirst, heavy sweating, nausea, and weakness. If symptoms worsen or exposure is prolonged, one can become confused, dizzy, or unconscious from heat stroke, the more emergent and deadly of the two 8. These illnesses can go from uncomfortable to fatal in minutes, so it is important to know these distinctions. Like wildfire smoke, the effects of heat can be particularly harmful for those that are more vulnerable. Factors like age, underlying health conditions, environment, and socioeconomic level all affect how equipped individuals are to respond to extreme heat events 7,8.
Visit the Gonzaga University Institute for Climate, Water, and the Environment website for insight into strengthening heat resilience in the local Spokane area. This resource includes interactive urban heat island and cooling resources maps, information about heat impacts, and recommendations for staying cool in Spokane 3.
The following individuals are found to be more at-risk from exposure to extreme heat 7:
People, especially children, with asthma
People with heart disease
Pregnant individuals
People 65 years of age or older
People who work or exercise outside in the heat
Infants and young children
People without air conditioning
If you or someone you know is vulnerable to extreme heat, there are several important ways to keep cool - stay hydrated, wear lightweight clothing, avoid strenuous activity during peak sun hours, and spend time in air-conditioned spaces whenever possible. Just as importantly, check on your neighbors to make sure they’re safe and staying cool too. A quick call or visit can make a big difference 7.
The National Weather Service (NWS) offers a range of heat safety tools designed to help individuals, communities, and organizations prepare for and respond to extreme heat events. These include real-time heat index maps (like Figure 3), hourly forecasts, and interactive planning tools like the HeatRisk dashboard, which highlights the severity of heat exposure across regions. These tools are especially valuable for identifying when and where heat-related illnesses are most likely to occur.
Whether you're a public health official, a caregiver, or just planning your day, monitoring these resources can help you take proactive steps, like adjusting outdoor activity, finding cooling centers, or checking on vulnerable individuals. To explore these tools and learn more, visit weather.gov/safety/heat-tools 9.

Figure 3. NWS Heat Index Chart 9.
Washington State Department of Ecology, "Wildfire Risks Caused by Climate Change." Wildfire Risks, Accessed 15 June 2025, https://ecology.wa.gov/air-climate/responding-to-climate-change/wildfire-risks.
BERK Consulting, Inc., Cascadia Consulting Group. "Spokane Climate Impacts and Climate Justice." Climate Planning, 14 January 2025, https://static.spokanecity.org/documents/planspokane/climate-planning/spokane-climate-impacts-and-climate-justice-memo-2025-03-07.pdf
Henning, Brian G., Kaitlan Ducken, Karli Honebein, Corrina Farho, and Ben Brown. “Spokane Beat the Heat: Correlations of Urban Heat with Race and Income in Spokane, Washington.” The Repository of Gonzaga University, April 2023, https://repository.gonzaga.edu/ccsereach/1/.
Mellinder, Kaitlin. "Let’s Talk Urban Heat!" 8 August 2023, https://my.spokanecity.org/news/stories/2023/08/08/lets-talk-urban-heat/.
AirNow.Gov, "Air Quality Guide for Particle Pollution," February 2023, https://www.airnow.gov/publications/air-quality-index/air-quality-guide-for-particle-pollution/.
Spokane Regional Health District, "Air Quality & Wildfire FAQ," 2025, https://srhd.org/health-topics/environmental-health/wildfire-smoke/air-quality-wildfire-faq.
Heat Health - CDC, “About Heat and Your Health,” 25 June 2024, https://www.cdc.gov/heat-health/about/index.html.
US Department of Commerce, NOAA, "Heat Cramps, Exhaustion, Stroke." Accessed 15 June 2025, https://preview.weather.gov/safety/heat-illness.
US Department of Commerce, NOAA, "Heat Forecast Tools," Accessed 15 June 2025, https://www.weather.gov/safety/heat-tools.
Woods, Alden. “Washington State’s 2021 Heat Wave Contributed to 159 Excess Injury Deaths over Three Weeks.” UW News, University of Washington, 6 April 2023, www.washington.edu/news/2023/04/06/washington-states-2021-heat-wave-contributed-to-159-excess-injury-deaths-over-three-weeks/.